Kategorier i Tepalcingo
Bransjer
Bedriftsfordeling etter bransje i Tepalcingo
| Bransjebeskrivelse | Antall bedrifter |
|---|---|
| Restauranter | 59 |
| Matbutikker og supermarkeder | 49 |
| Handling | 41 |
| Undervisning | 36 |
| Kirker | 24 |
| Jernvareforretning | 19 |
| Barer og puber | 19 |
| Bilreperasjon | 14 |
| Dagligvarebutikker | 13 |
| Religion | 13 |
Tepalcingo fakta
| Område | 3.4 km² |
| Befolkning | 13 018 |
| Mannlig befolkning | 6 277 (48.2%) |
| Befolkning av kvinner | 6 741 (51.8%) |
| Befolkningsendring (1975 to 2020) | +132.3% |
| Befolkningsendring (2000 to 2020) | +19.8% |
| Gjennomsnittsalder | 26.9 år (Menn: 26.7, Kvinner: 27.1) |
| BNP per innbygger (PPP) | $23 601 (2022) |
| Retningsnumre | 467 |
| Nabolag | San Martin, Guadalupe, Centro, Santa Cruz, Buenos Aires |
| Lokal tid | |
| Tidssone | normaltid for det sentrale Nord-Amerika |
| Bredde- & lengdegrad | 18.59582, -98.84302 |
| Postnumre | 62920, 62923, 62924, 62925, 62926, More |
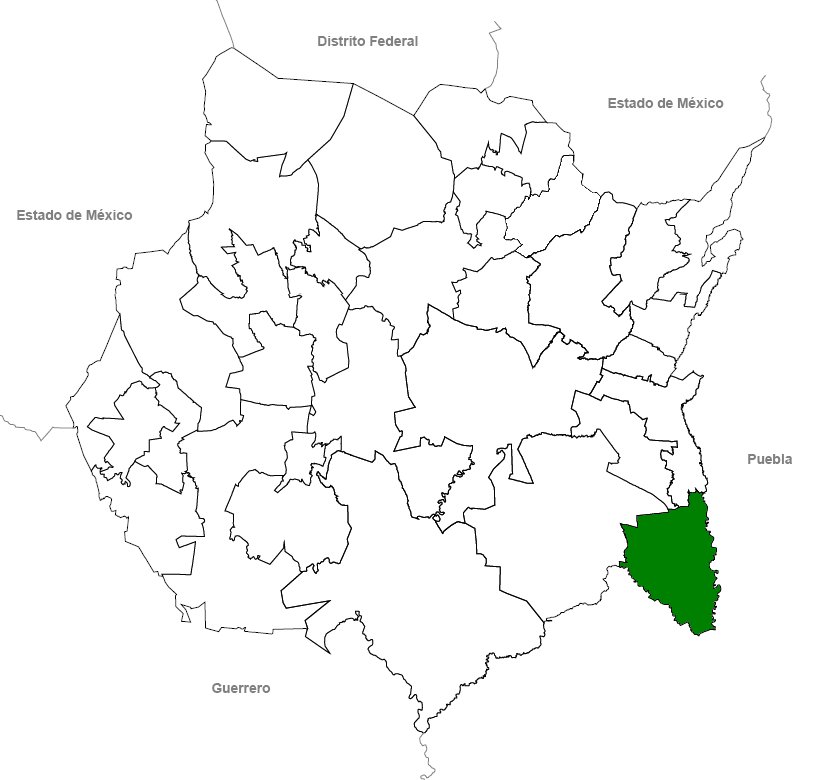
Kart over Tepalcingo
Interaktivt kart
Tepalcingo befolkning
Årene 1975 til 2030
| Data | 1975 | 1990 | 2000 | 2015 | 2020 | 2025* | 2030* |
|---|---|---|---|---|---|---|---|
| Befolkning | 5 603 | 8 694 | 10 865 | 13 520 | 13 018 | 13 631 | 14 175 |
| Befolkningstetthet | 1 660,1 / km² | 2 576 / km² | 3 219,3 / km² | 4 005,9 / km² | 3 857,2 / km² | 4 038,8 / km² | 4 200 / km² |
Tepalcingo befolkningsendring fra 2000 til 2020
Økning på 19.8% fra 2000 til 2020
| Beliggenhet | Endring siden 1975 | Endring siden 1990 | Endring siden 2000 |
|---|---|---|---|
| Tepalcingo | +132.3% | +49.7% | +19.8% |
| Morelos | — | — | — |
| Mexico | — | — | — |
Tepalcingo medianalder
Medianalder: 26.9 år
| Beliggenhet | Gjennomsnittsalder | Median alder (kvinne) | Median alder (mann) |
|---|---|---|---|
| Tepalcingo | 26.9 yrs | 27.1 yrs | 26.7 yrs |
| Morelos | 27.1 yrs | 28.1 yrs | 25.9 yrs |
| Mexico | 26.2 yrs | 27 yrs | 25.3 yrs |
Tepalcingo befolkningstetthet
Befolkningstetthet: 3 857 / km²
| Beliggenhet | Befolkning | Område | Tetthet |
|---|---|---|---|
| Tepalcingo | 13 018 | 3,375 km² | 3 857 / km² |
| Morelos | 2 million | 4 878,9 km² | 413 / km² |
| Mexico | 126,8 million | 1 965 208 km² | 64,5 / km² |
Tepalcingo historisk og prognostisert befolkning
Estimert befolkning fra 0 til 2100
- JRC (European Commission's Joint Research Centre) arbeid med GHS built-up grid
- CIESIN (Center for International Earth Science Information Network)
- [link] Klein Goldewijk, K., Beusen, A., Doelman, J., and Stehfest, E.: Anthropogenic land use estimates for the Holocene – HYDE 3.2, Earth Syst. Sci. Data, 9, 927–953, https://doi.org/10.5194/essd-9-927-2017, 2017.
Nabolag i Tepalcingo
Prosentandel av bedrifter etter nabolag i Tepalcingo
Postnumre
Prosentandel av bedrifter etter postnummer i Tepalcingo
Prisfordeling
Bedriftsfordeling etter pris for Tepalcingo
Human Development Index (HDI)
Statistisk sammensatt indeks over forventet levealder, utdanning og inntekt per innbygger.
Tepalcingo bruttonasjonalprodukt (BNP)
BNP per innbygger, PPP (faste internasjonale dollar fra 2017)
| Data | 1990 | 1995 | 2000 | 2005 | 2010 | 2015 | 2020 | 2022 |
|---|---|---|---|---|---|---|---|---|
| BNP per innbygger | $11 455 | $9 225 | $12 934 | $14 231 | $15 195 | $12 811 | $21 661 | $23 601 |
| Totalt BNP | $210,4 mill. | $188,2 mill. | $288,1 mill. | $349,4 mill. | $401,1 mill. | $366,5 mill. | $701 mill. | $776,7 mill. |
Tepalcingo CO2-utslipp
Utslipp av karbondioksid (CO2) per innbygger i tonn per år
| Beliggenhet | CO2-utslipp | CO2-utslipp per innbygger | CO2-utslippsintensitet |
|---|---|---|---|
| Tepalcingo | 53,231 tn | 4.09 tn | 15,772.2 tons/km² |
| Morelos | 8,037,033 tn | 3.99 tn | 1,647.3 tons/km² |
| Mexico | 496,865,013 tn | 3.92 tn | 252.8 tons/km² |
| CO2-utslipp i 2013 (tonn/år) | 53,231 tn |
| CO2-utslipp i 2013 (tonn/år) per person | 4.09 tn |
| CO2-utslippsintensitet i 2013 (tonn/km²/år) | 15,772.2 tons/km² |
Naturlige farer
Relativ risiko av 10
| Fare | Risikonivå |
|---|---|
| Tørke | Middels (4) |
| Oversvømmelse | Høy (8) |
| Jordskjelv | Middels (6) |
* Risiko, spesielt for flom eller skred, kan ikke være for hele området.
- Dilley, M., R.S. Chen, U. Deichmann, A.L. Lerner-Lam, M. Arnold, J. Agwe, P. Buys, O. Kjekstad, B. Lyon, and G. Yetman. 2005. Natural Disaster Hotspots: A Global Risk Analysis. Washington, D.C.: World Bank. https://doi.org/10.1596/0-8213-5930-4.
- Center for Hazards and Risk Research - CHRR - Columbia University, Center for International Earth Science Information Network - CIESIN - Columbia University, and International Research Institute for Climate and Society - IRI - Columbia University. 2005. Global Drought Hazard Frequency and Distribution. Palisades, NY: NASA Socioeconomic Data and Applications Center (SEDAC). https://doi.org/10.7927/H4VX0DFT.
- Center for Hazards and Risk Research - CHRR - Columbia University, Center for International Earth Science Information Network - CIESIN - Columbia University. 2005. Global Flood Hazard Frequency and Distribution. Palisades, NY: NASA Socioeconomic Data and Applications Center (SEDAC). https://doi.org/10.7927/H4668B3D.
- Center for Hazards and Risk Research - CHRR - Columbia University, Center for International Earth Science Information Network - CIESIN - Columbia University. 2005. Global Earthquake Hazard Distribution - Peak Ground Acceleration. Palisades, NY: NASA Socioeconomic Data and Applications Center (SEDAC). https://doi.org/10.7927/H4BZ63ZS.
Nylige jordskjelv i nærheten
Størrelse 3.0 og større
| Dato▼ | Tid↕ | Magnitude↕ | Distance↕ | Dybde↕ | Beliggenhet↕ | link |
|---|---|---|---|---|---|---|
| 9/19/17 | 6:14 PM | 7.1 | 37.7 km | 48,000 m | 1km E of Ayutla, Mexico | usgs.gov |
| 3/20/15 | 10:30 PM | 5.4 | 71.4 km | 52,000 m | 8km WSW of Tulcingo del Valle, Mexico | usgs.gov |
| 6/29/13 | 9:19 PM | 4.5 | 67.3 km | 55,100 m | 14km NNW of Copalillo, Mexico | usgs.gov |
| 6/21/13 | 9:41 AM | 4 | 14.4 km | 2,000 m | Morelos, Mexico | usgs.gov |
| 6/16/13 | 5:19 AM | 5.8 | 61.9 km | 52,000 m | 15km NW of Copalillo, Mexico | usgs.gov |
| 5/6/13 | 8:33 AM | 4.1 | 52.3 km | 1,000 m | Puebla, Mexico | usgs.gov |
| 9/7/10 | 10:44 PM | 4.5 | 63.5 km | 51,200 m | Puebla, Mexico | usgs.gov |
| 5/22/09 | 7:24 PM | 5.6 | 67.1 km | 62,300 m | Puebla, Mexico | usgs.gov |
| 10/5/08 | 1:40 AM | 3.2 | 31 km | 2,000 m | Morelos, Mexico | usgs.gov |
| 5/21/08 | 5:05 AM | 3.5 | 51.6 km | 62,100 m | Puebla, Mexico | usgs.gov |

Om våre data
Dataene på denne siden er estimert ved hjelp av en rekke offentlig tilgjengelige verktøy og ressurser. De leveres uten garanti og kan inneholde unøyaktigheter. Bruk på eget ansvar.