Bransjer
Bedriftsfordeling etter bransje i Kensington
| Bransjebeskrivelse | Antall bedrifter |
|---|---|
| Konsernledelse | 19 |
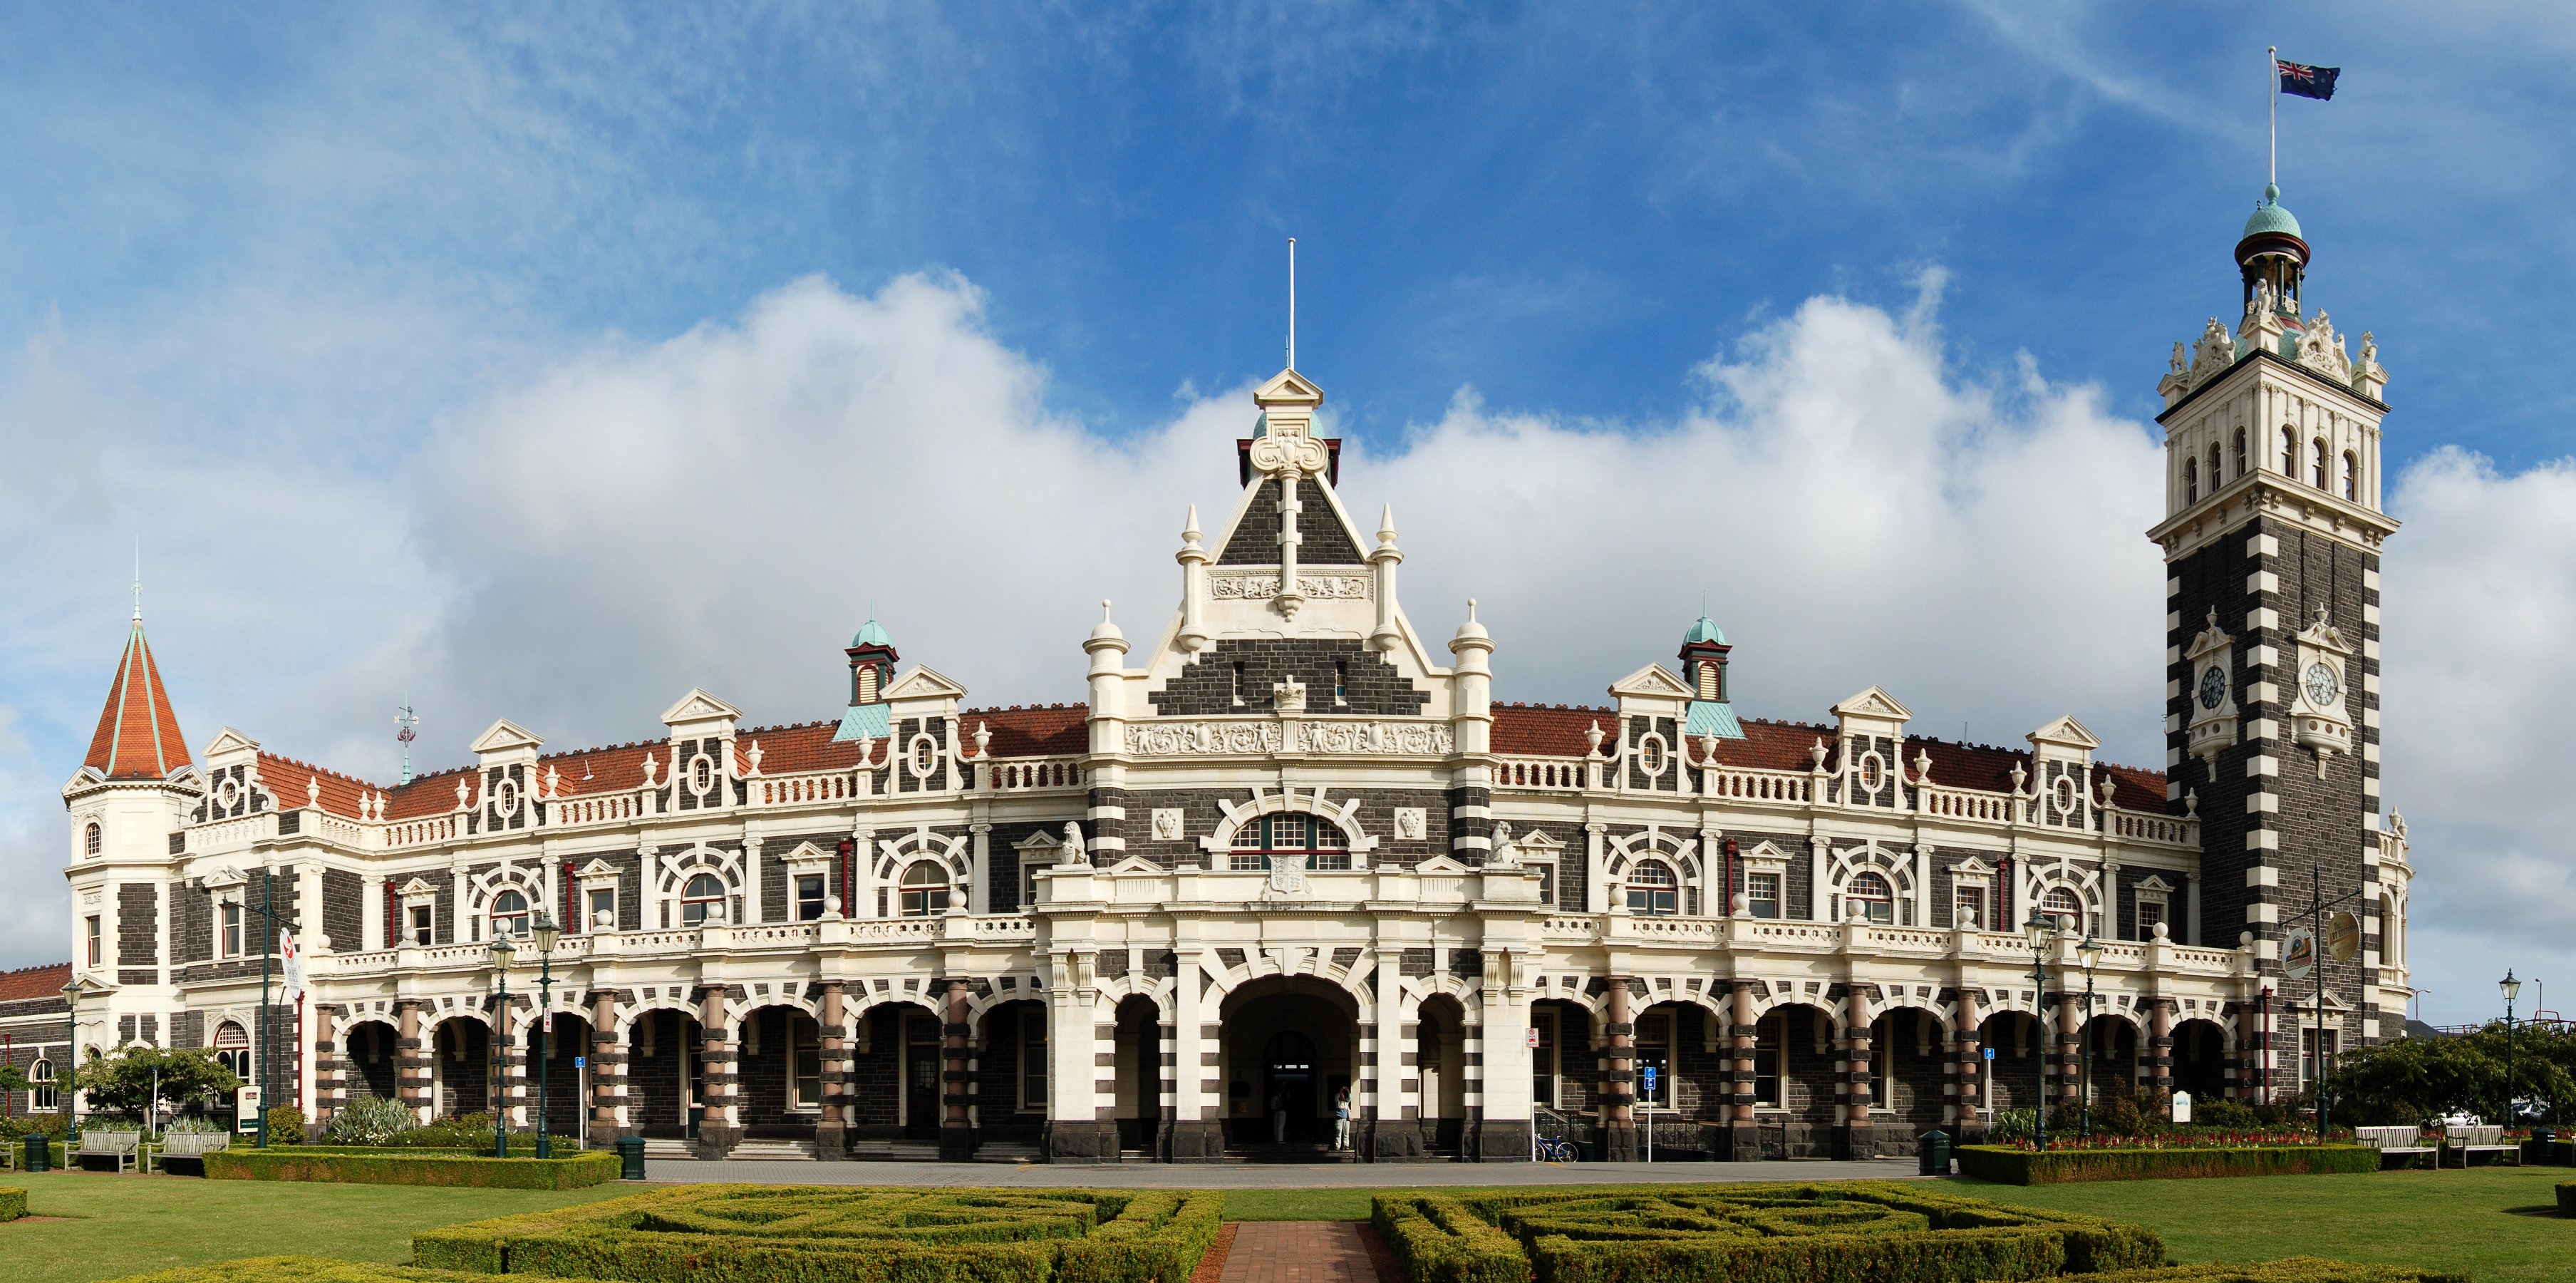
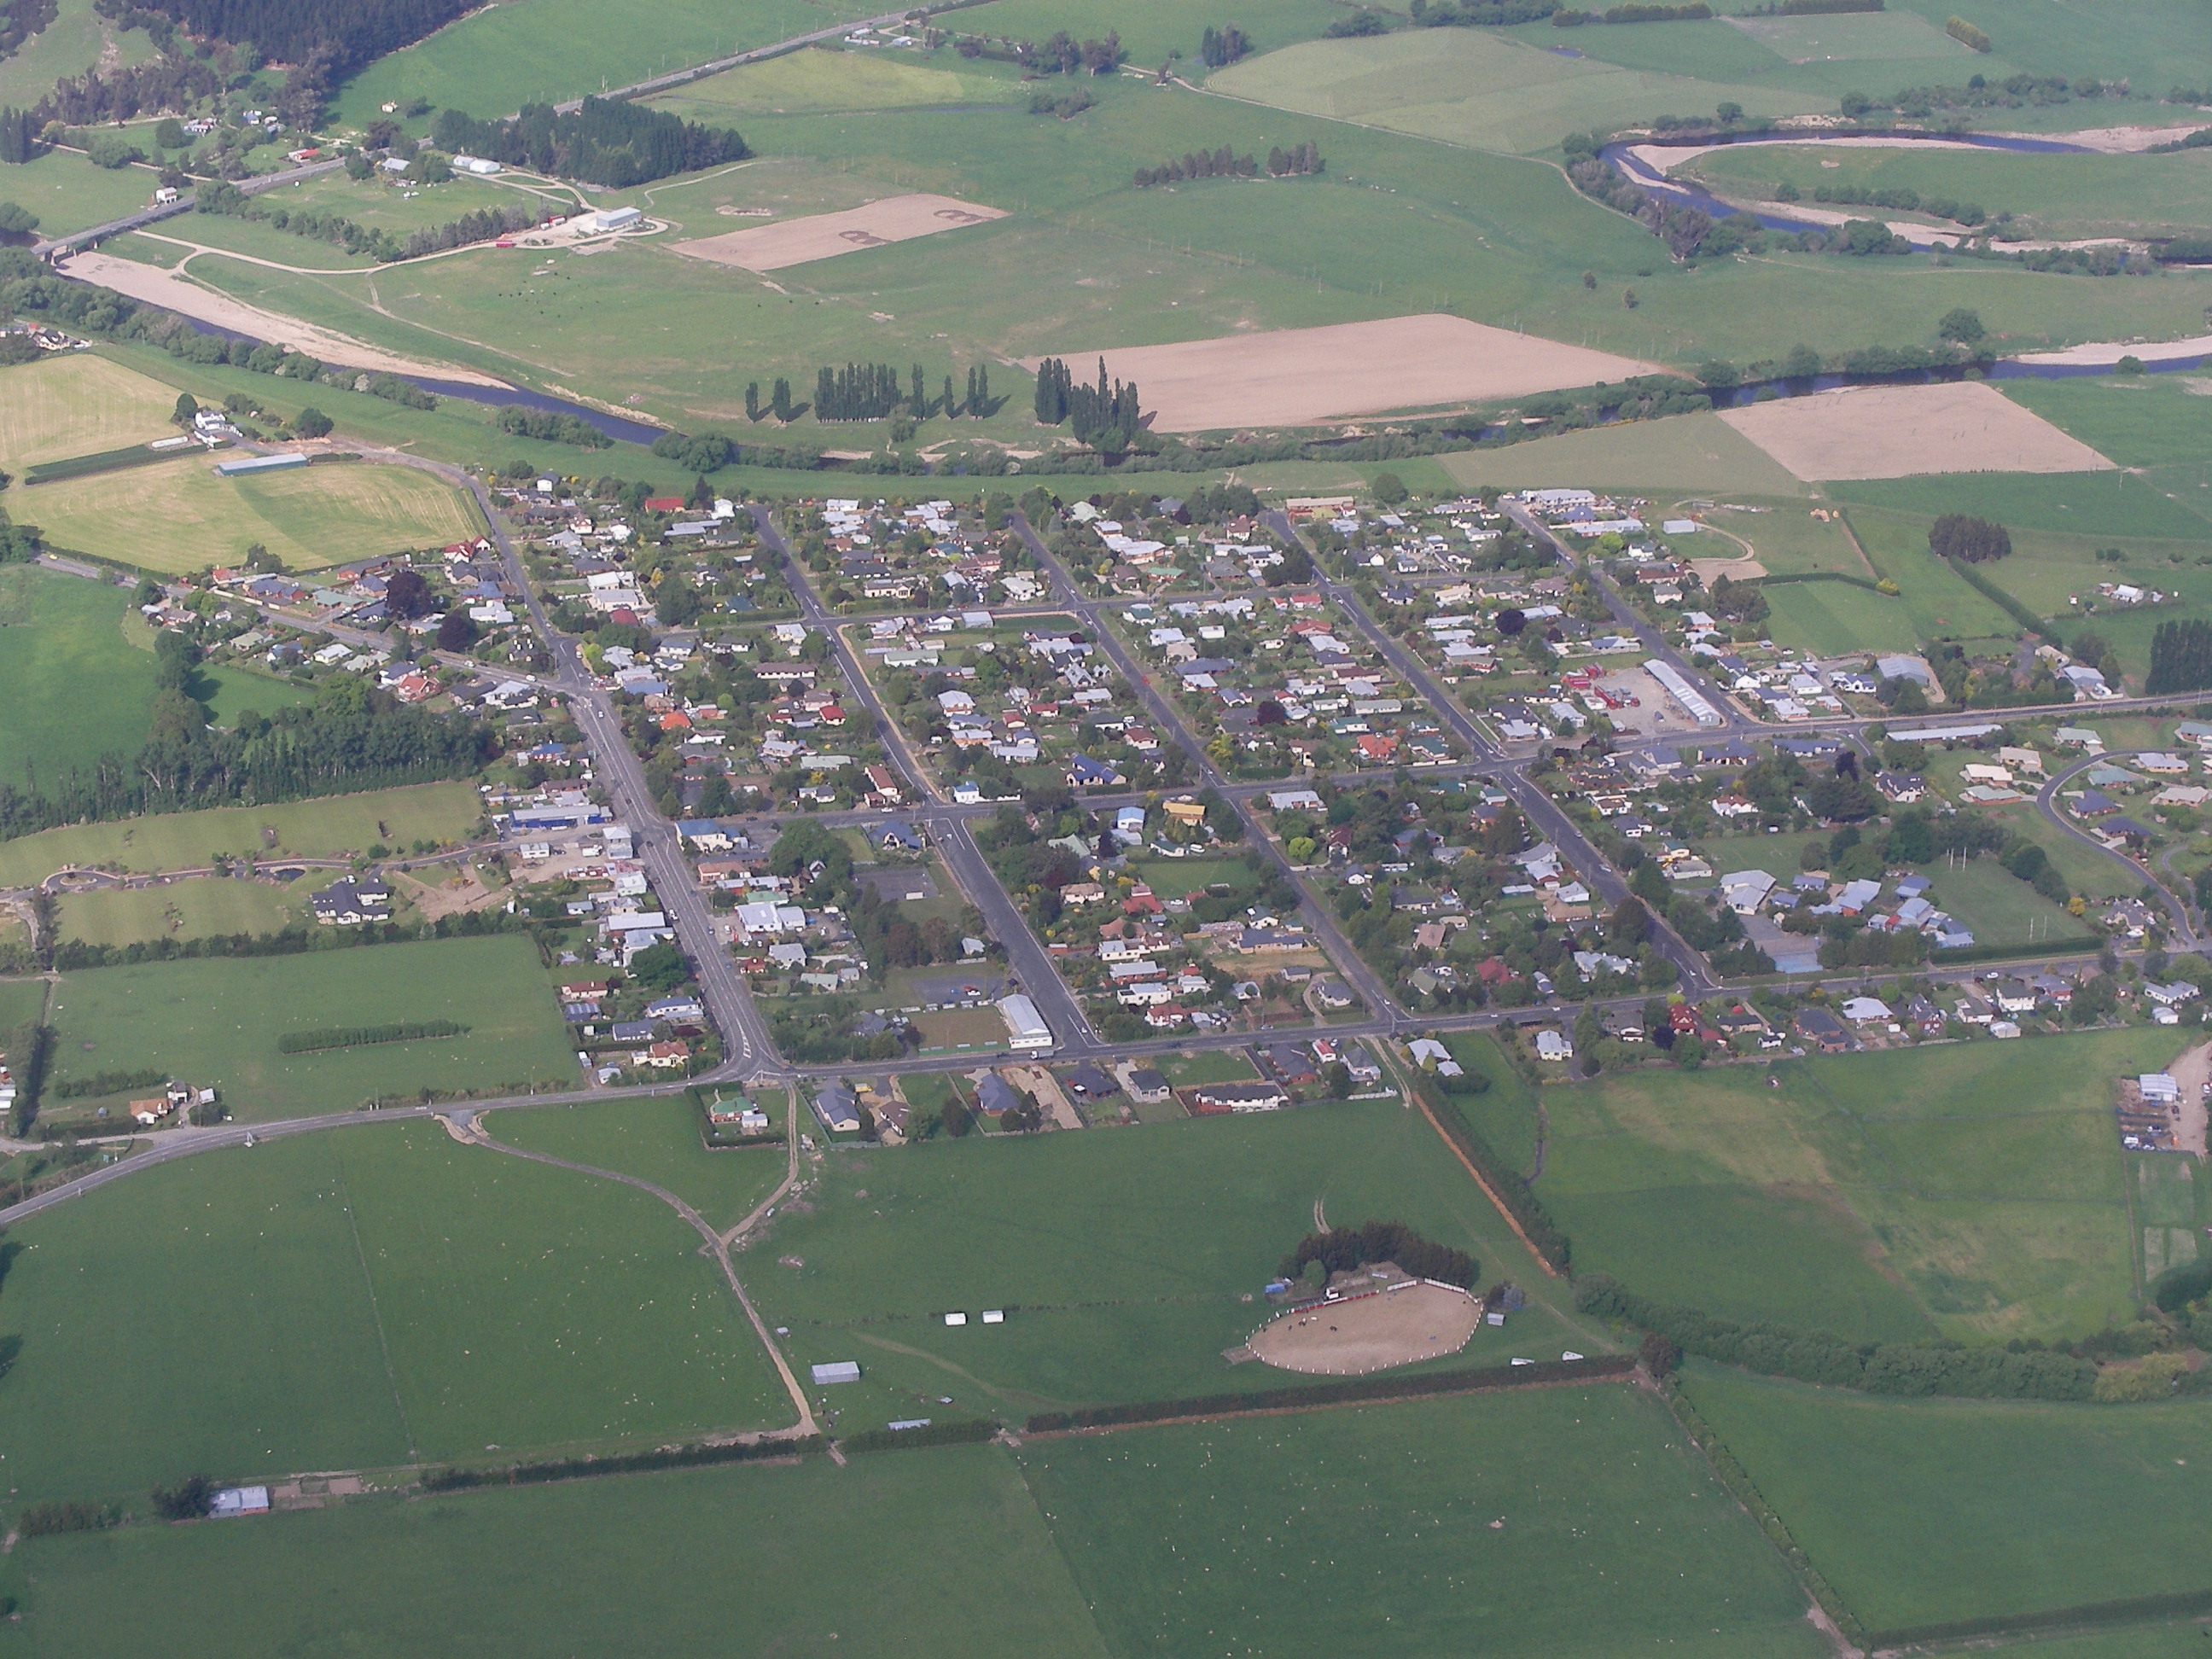
Kensington fakta
| Område | 0.8 km² |
| Befolkning | 7 |
| Befolkningsendring (1975 to 2020) | -97.6% |
| Befolkningsendring (2000 to 2020) | -97.9% |
| Nabolag | Kensington, Regent |
| Lokal tid | |
| Tidssone | newzealandsk normaltid |
| Bredde- & lengdegrad | -45.88838, 170.49010 |
Kart over Kensington
Interaktivt kart
Kensington befolkning
Årene 1975 til 2030
| Data | 1975 | 1990 | 2000 | 2015 | 2020 | 2025* | 2030* |
|---|---|---|---|---|---|---|---|
| Befolkning | 294 | 307 | 327 | 351 | 7 | 7 | 7 |
| Befolkningstetthet | 361,8 / km² | 377,8 / km² | 402,5 / km² | 432 / km² | 8,6 / km² | 8,6 / km² | 8,6 / km² |
Kensington befolkningsendring fra 2000 til 2020
Nedgang på 97.9% fra 2000 til 2020
| Beliggenhet | Endring siden 1975 | Endring siden 1990 | Endring siden 2000 |
|---|---|---|---|
| Kensington | -97.6% | -97.7% | -97.9% |
| Otago | — | — | — |
| New Zealand | — | — | — |
Kensington befolkningstetthet
Befolkningstetthet: 8,6 / km²
| Beliggenhet | Befolkning | Område | Tetthet |
|---|---|---|---|
| Kensington | 7 | 0,813 km² | 8,6 / km² |
| Otago | 215 607 | 38 478,4 km² | 5,6 / km² |
| New Zealand | 4,4 million | 270 103,3 km² | 16,3 / km² |
Kensington historisk og prognostisert befolkning
Estimert befolkning fra 0 til 2100
- JRC (European Commission's Joint Research Centre) arbeid med GHS built-up grid
- CIESIN (Center for International Earth Science Information Network)
- [link] Klein Goldewijk, K., Beusen, A., Doelman, J., and Stehfest, E.: Anthropogenic land use estimates for the Holocene – HYDE 3.2, Earth Syst. Sci. Data, 9, 927–953, https://doi.org/10.5194/essd-9-927-2017, 2017.
Retningsnumre
Prosent Områdekoder bruk av bedrifter i Kensington
Postnumre
Prosentandel av bedrifter etter postnummer i Kensington
Prisfordeling
Bedriftsfordeling etter pris for Kensington
Human Development Index (HDI)
Statistisk sammensatt indeks over forventet levealder, utdanning og inntekt per innbygger.
Kensington CO2-utslipp
Utslipp av karbondioksid (CO2) per innbygger i tonn per år
| Beliggenhet | CO2-utslipp | CO2-utslipp per innbygger | CO2-utslippsintensitet |
|---|---|---|---|
| Kensington | 62 tn | 8.89 tn | 76.6 tons/km² |
| Otago | 1,696,568 tn | 7.87 tn | 44.1 tons/km² |
| New Zealand | 37,929,206 tn | 8.61 tn | 140.4 tons/km² |
| CO2-utslipp i 2013 (tonn/år) | 62 tn |
| CO2-utslipp i 2013 (tonn/år) per person | 8.89 tn |
| CO2-utslippsintensitet i 2013 (tonn/km²/år) | 76.6 tons/km² |
Naturlige farer
Relativ risiko av 10
| Fare | Risikonivå |
|---|---|
| Jordskjelv | Middels (7) |
* Risiko, spesielt for flom eller skred, kan ikke være for hele området.
- Dilley, M., R.S. Chen, U. Deichmann, A.L. Lerner-Lam, M. Arnold, J. Agwe, P. Buys, O. Kjekstad, B. Lyon, and G. Yetman. 2005. Natural Disaster Hotspots: A Global Risk Analysis. Washington, D.C.: World Bank. https://doi.org/10.1596/0-8213-5930-4.
- Center for Hazards and Risk Research - CHRR - Columbia University, Center for International Earth Science Information Network - CIESIN - Columbia University. 2005. Global Earthquake Hazard Distribution - Peak Ground Acceleration. Palisades, NY: NASA Socioeconomic Data and Applications Center (SEDAC). https://doi.org/10.7927/H4BZ63ZS.
Nylige jordskjelv i nærheten
Størrelse 3.0 og større
| Dato▼ | Tid↕ | Magnitude↕ | Distance↕ | Dybde↕ | Beliggenhet↕ | link |
|---|---|---|---|---|---|---|
| 6/1/15 | 11:18 AM | 4.3 | 33.4 km | 8,990 m | 33km WNW of Dunedin, New Zealand | usgs.gov |
| 10/16/14 | 5:44 AM | 4.1 | 29.5 km | 4,000 m | 29km WNW of Dunedin, New Zealand | usgs.gov |
| 12/17/07 | 9:05 AM | 4.2 | 38.5 km | 12,000 m | off the east coast of the South Island of New Zealand | usgs.gov |
| 2/24/06 | 11:03 PM | 3.7 | 56.8 km | 12,000 m | off the east coast of the South Island of New Zealand | usgs.gov |
| 12/24/04 | 8:44 AM | 3.9 | 81.6 km | 12,000 m | South Island of New Zealand | usgs.gov |
| 2/11/04 | 12:31 AM | 4.5 | 77.6 km | 12,000 m | South Island of New Zealand | usgs.gov |
| 6/30/03 | 4:23 PM | 3.8 | 78.8 km | 21,000 m | South Island of New Zealand | usgs.gov |
| 10/21/00 | 1:57 PM | 4 | 96.6 km | 12,000 m | off the east coast of the South Island of New Zealand | usgs.gov |
| 10/12/00 | 8:40 AM | 4.5 | 96 km | 31,000 m | South Island of New Zealand | usgs.gov |
| 5/3/94 | 7:29 AM | 3.8 | 23.1 km | 33,000 m | off the east coast of the South Island of New Zealand | usgs.gov |

Om våre data
Dataene på denne siden er estimert ved hjelp av en rekke offentlig tilgjengelige verktøy og ressurser. De leveres uten garanti og kan inneholde unøyaktigheter. Bruk på eget ansvar.