Kategorier i Leon
BensinstasjonLandbrukKirkerOffentlig kontorSamfunnshushus utviklingBarneskoleUndervisningUtdanningsinstitusjonVideregående skoleTuristattraksjonBakerierCateringKafeerKaffebutikkMatbutikker og supermarkederRestauranterBarnerom- og hageartiklerPengeoverføringstjenesteBoligkompleksEiendomsmeglerLeiegårdDagligvarebutikkerHandlingPantebutikkerTreningsstudioBorettslagHoteller
Industries
Bedriftsfordeling etter bransje i Leon
| Bransjebeskrivelse | Antall bedrifter | Gjennomsnittlig Google-rangering |
|---|---|---|
| Undervisning | 25 | 3.8 |
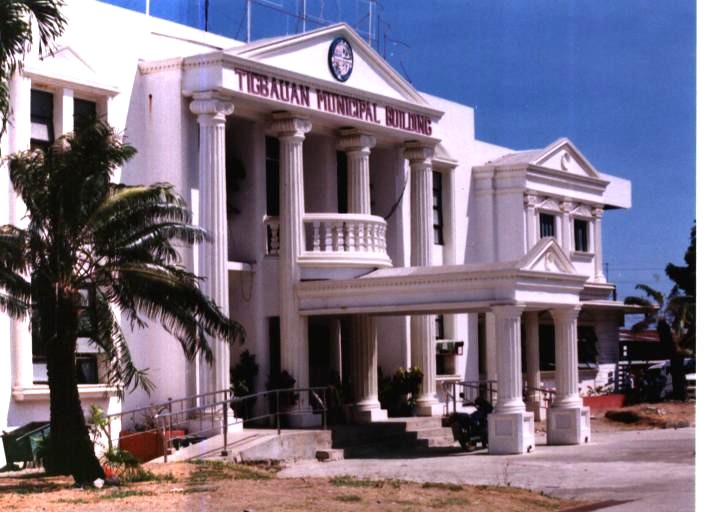
| Offentlig administrasjon | 15 | 5 |
| Grunnskoler og barneskoler | 14 | 3.1 |
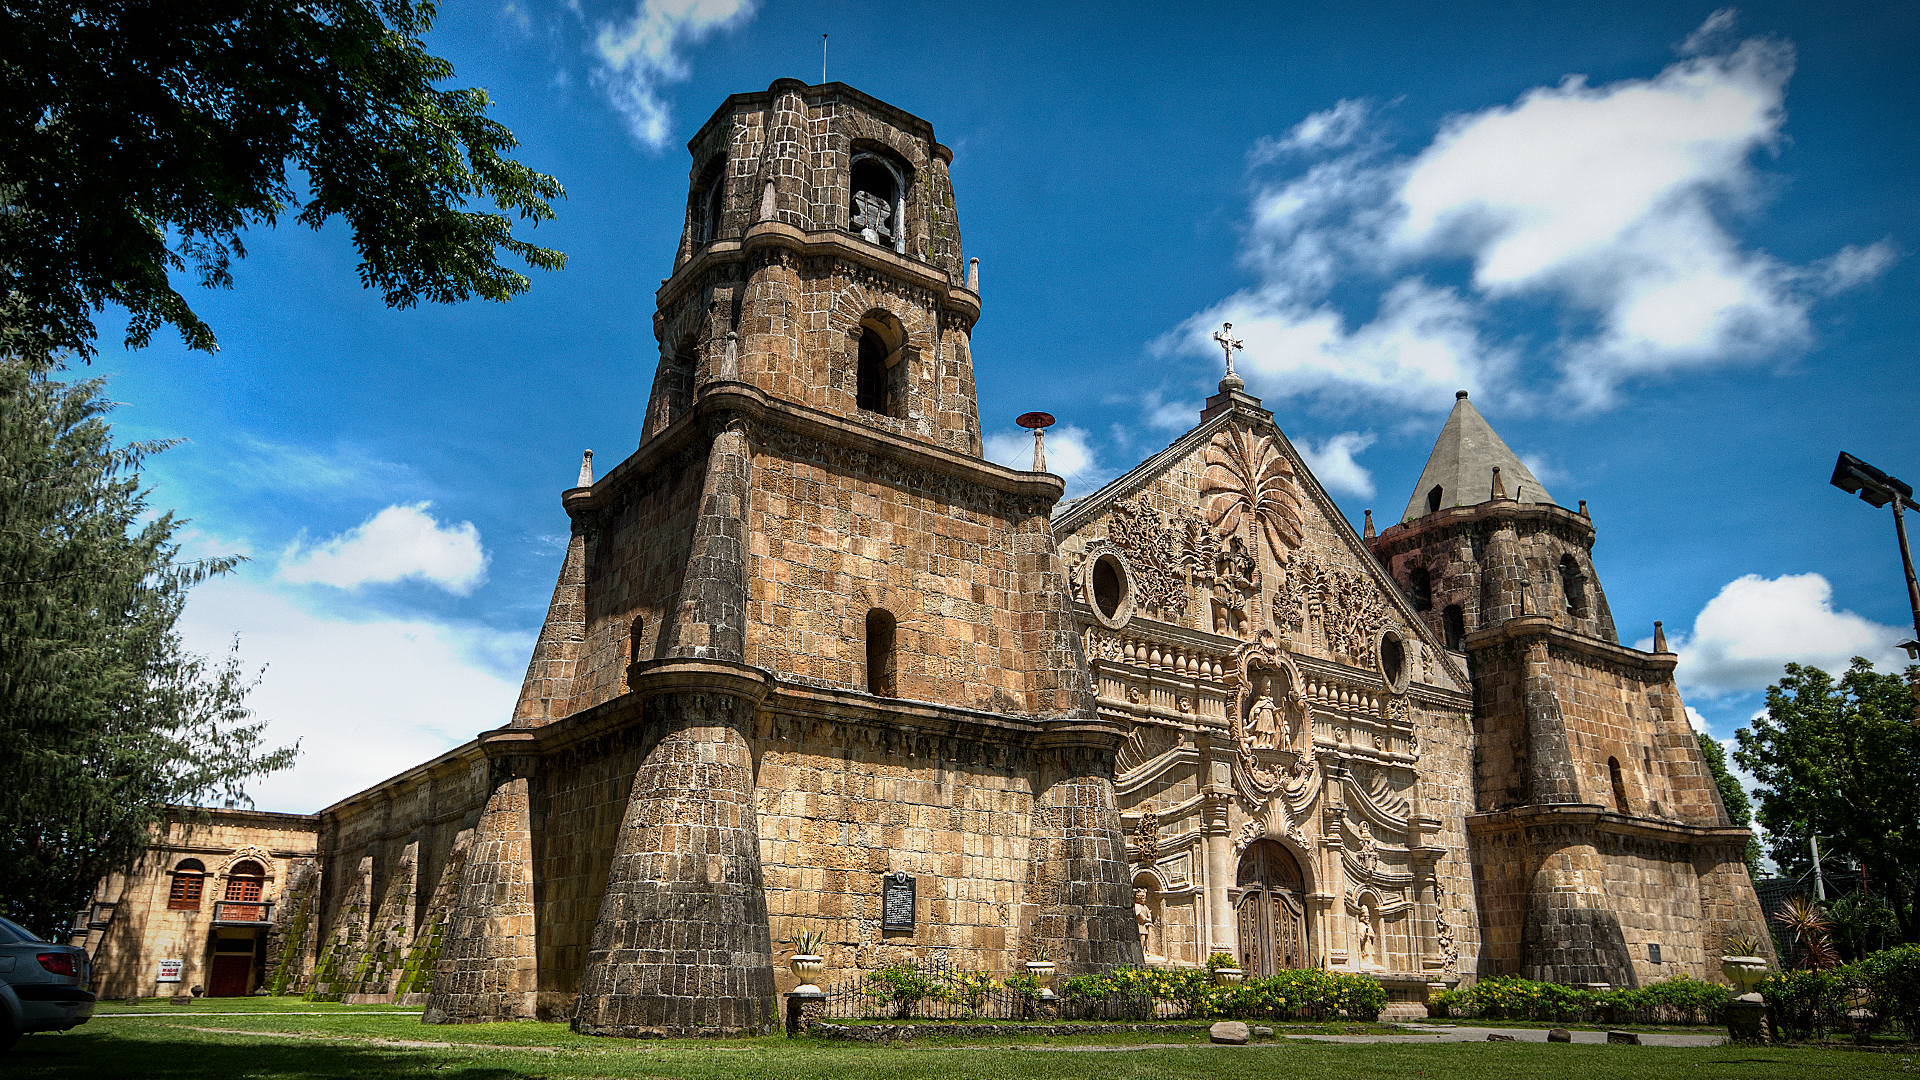
| Kirker | 5 | 5 |
Leon fakta
| Område | 130.8 km² |
| Befolkning | 51 964 |
| Mannlig befolkning | 26 875 (51.7%) |
| Befolkning av kvinner | 25 089 (48.3%) |
| Befolkningsendring (1975 to 2020) | +406.4% |
| Befolkningsendring (2000 to 2020) | +41.0% |
| Gjennomsnittsalder | 25.3 år (Menn: 24.5, Kvinner: 26.3) |
| Lokal tid | |
| Tidssone | filippinsk normaltid |
| Bredde- & lengdegrad | 10.78085, 122.38940 |
| Postnumre | 5026 |
Kart over Leon
Interaktivt kart
Leon befolkning
Årene 1975 til 2020
| Data | 1975 | 1990 | 2000 | 2015 | 2020 |
|---|---|---|---|---|---|
| Befolkning | 10 262 | 26 064 | 36 865 | 47 944 | 51 964 |
| Befolkningstetthet | 78,5 / km² | 199,3 / km² | 282 / km² | 366,7 / km² | 397,4 / km² |
Kilder: JRC (European Commission's Joint Research Centre) arbeid med GHS built-up grid
Leon befolkningsendring fra 2000 til 2015
Økning på 30.1% fra 2000 til 2015
| Beliggenhet | Endring siden 1975 | Endring siden 1990 | Endring siden 2000 |
|---|---|---|---|
| Leon | +367.2% | +83.9% | +30.1% |
| Filippinene | +146.5% | +63.3% | +29.5% |
Kilder: JRC (European Commission's Joint Research Centre) arbeid med GHS built-up grid
Leon medianalder
Medianalder: 25.3 år
| Beliggenhet | Gjennomsnittsalder | Median alder (kvinne) | Median alder (mann) |
|---|---|---|---|
| Leon | 25.3 yrs | 26.3 yrs | 24.5 yrs |
| Filippinene | 23.2 yrs | 23.6 yrs | 22.8 yrs |
Kilder: CIESIN (Center for International Earth Science Information Network)
Leon befolkningstetthet
Befolkningstetthet: 397 / km²
| Beliggenhet | Befolkning | Område | Tetthet |
|---|---|---|---|
| Leon | 51 964 | 130,8 km² | 397 / km² |
| Filippinene | 96,6 million | 296 939,4 km² | 325 / km² |
Kilder: JRC (European Commission's Joint Research Centre) arbeid med GHS built-up grid
Leon historisk og prognostisert befolkning
Estimert befolkning fra 1840 til 2100
Kilder:
- JRC (European Commission's Joint Research Centre) arbeid med GHS built-up grid
- CIESIN (Center for International Earth Science Information Network)
- [link] Klein Goldewijk, K., Beusen, A., Doelman, J., and Stehfest, E.: Anthropogenic land use estimates for the Holocene – HYDE 3.2, Earth Syst. Sci. Data, 9, 927–953, https://doi.org/10.5194/essd-9-927-2017, 2017.
Retningsnumre
Prosent Områdekoder bruk av bedrifter i Leon
Prisfordeling
Bedriftsfordeling etter pris for Leon
Human Development Index (HDI)
Statistisk sammensatt indeks over forventet levealder, utdanning og inntekt per innbygger.
Kilde: [link] Kummu, M., Taka, M. &Guillaume, J. Gridded global datasets for Gross Domestic Product and Human Development Index over 1990–2015. Sci Data 5, 180004 (2018) doi:10.1038/sdata.2018.4
Leon CO2-utslipp
Utslipp av karbondioksid (CO2) per innbygger i tonn per år
| Beliggenhet | CO2-utslipp | CO2-utslipp per innbygger | CO2-utslippsintensitet |
|---|---|---|---|
| Leon | 63,785 tn | 1.23 tn | 487.8 tons/km² |
| Filippinene | 104,920,564 tn | 1.09 tn | 353.3 tons/km² |
Kilder: [link] Moran, D., Kanemoto K; Jiborn, M., Wood, R., Többen, J., and Seto, K.C. (2018) Carbon footprints of 13,000 cities. Environmental Research Letters DOI: 10.1088/1748-9326/aac72a
Leon CO2-utslipp
| CO2-utslipp i 2013 (tonn/år) | 63,785 tn |
| CO2-utslipp i 2013 (tonn/år) per person | 1.23 tn |
| CO2-utslippsintensitet i 2013 (tonn/km²/år) | 487.8 tons/km² |
Naturlige farer
Relative risk out of 10
| Fare | Risk Level |
|---|---|
| Drought | Medium (7) |
| Flood | High (8) |
| Earthquake | Medium (7) |
| Cyclone | High (10) |
| Landslide | Medium (7) |
* Risk, particularly concerning flood or landslide, may not be for the entire area.
Kilder:
- Dilley, M., R.S. Chen, U. Deichmann, A.L. Lerner-Lam, M. Arnold, J. Agwe, P. Buys, O. Kjekstad, B. Lyon, and G. Yetman. 2005. Natural Disaster Hotspots: A Global Risk Analysis. Washington, D.C.: World Bank. https://doi.org/10.1596/0-8213-5930-4.
- Center for Hazards and Risk Research - CHRR - Columbia University, Center for International Earth Science Information Network - CIESIN - Columbia University, and Norwegian Geotechnical Institute - NGI. 2005. Global Landslide Hazard Distribution. Palisades, NY: NASA Socioeconomic Data and Applications Center (SEDAC). https://doi.org/10.7927/H4P848VZ.
- Center for Hazards and Risk Research - CHRR - Columbia University, Center for International Earth Science Information Network - CIESIN - Columbia University, International Bank for Reconstruction and Development - The World Bank, and United Nations Environment Programme Global Resource Information Database Geneva - UNEP/GRID-Geneva. 2005. Global Cyclone Hazard Frequency and Distribution. Palisades, NY: NASA Socioeconomic Data and Applications Center (SEDAC). https://doi.org/10.7927/H4CZ353K.
- Center for Hazards and Risk Research - CHRR - Columbia University, Center for International Earth Science Information Network - CIESIN - Columbia University, and International Research Institute for Climate and Society - IRI - Columbia University. 2005. Global Drought Hazard Frequency and Distribution. Palisades, NY: NASA Socioeconomic Data and Applications Center (SEDAC). https://doi.org/10.7927/H4VX0DFT.
- Center for Hazards and Risk Research - CHRR - Columbia University, Center for International Earth Science Information Network - CIESIN - Columbia University. 2005. Global Flood Hazard Frequency and Distribution. Palisades, NY: NASA Socioeconomic Data and Applications Center (SEDAC). https://doi.org/10.7927/H4668B3D.
- Center for Hazards and Risk Research - CHRR - Columbia University, Center for International Earth Science Information Network - CIESIN - Columbia University. 2005. Global Earthquake Hazard Distribution - Peak Ground Acceleration. Palisades, NY: NASA Socioeconomic Data and Applications Center (SEDAC). https://doi.org/10.7927/H4BZ63ZS.
Nylige jordskjelv i nærheten
Størrelse 3.0 og større
| Dato▼ | Tid↕ | Magnitude↕ | Distance↕ | Dybde↕ | Beliggenhet↕ | link |
|---|---|---|---|---|---|---|
| 4/21/19 | 3:54 AM | 4.5 | 84.1 km | 10,000 m | 14km WNW of Linaon, Philippines | usgs.gov |
| 11/5/18 | 2:54 AM | 4.9 | 18 km | 55,880 m | 2km SW of Igbaras, Philippines | usgs.gov |
| 11/4/18 | 11:46 PM | 4.7 | 38.7 km | 31,510 m | 5km NNW of San Remigio, Philippines | usgs.gov |
| 4/12/18 | 9:07 AM | 4.6 | 76.6 km | 33,040 m | 21km S of Magdalena, Philippines | usgs.gov |
| 10/8/17 | 12:42 PM | 4.5 | 53.2 km | 30,660 m | 3km WSW of Tapas, Philippines | usgs.gov |
| 7/25/17 | 8:41 PM | 4.3 | 73.1 km | 10,000 m | 30km SSE of Magdalena, Philippines | usgs.gov |
| 7/25/17 | 8:24 PM | 4.6 | 77.5 km | 10,000 m | 30km SSE of Magdalena, Philippines | usgs.gov |
| 7/25/17 | 7:51 PM | 4.9 | 69.9 km | 10,000 m | 26km SSE of Magdalena, Philippines | usgs.gov |
| 8/15/16 | 11:34 AM | 4.9 | 6.5 km | 26,550 m | 3km WNW of Alimodian, Philippines | usgs.gov |
| 8/15/16 | 11:32 AM | 5.4 | 25.2 km | 29,000 m | 13km NE of San Remigio, Philippines | usgs.gov |

Om våre data
Dataene på denne siden er estimert ved hjelp av en rekke offentlig tilgjengelige verktøy og ressurser. De leveres uten garanti og kan inneholde unøyaktigheter. Bruk på eget ansvar.