Virksomheter i Latulipe-et-Gaboury
Industries
Forretningsdistribusjon etter næring Underholdning: 12 %
Mat: 10 %
Medisinsk: 10 %
Hoteller og reiser: 10 %
Undervisning: 8 %
Restauranter: 8 %
Handling: 6 %
Økonomiske tjenester: 6 %
Sport og aktiviteter: 6 %
Industri: 4 %
Skjønnhet og spa: 4 %
Kommune og Region: 4 %
Andre: 12 %
| Område for Latulipe-et-Gaboury, Québec | 298,3 km² |
| Befolkning | 304 |
| Mannlig befolkning | 164 (54,1 %) |
| Befolkning av kvinner | 140 (45,9 %) |
| Befolkningsendring fra 1975 til 2015 | -21,2 % |
| Befolkningsendring fra 2000 til 2015 | -10,6 % |
| Gjennomsnittsalder | 50,4 |
| Mannlig gjennomsnittsalder | 50 |
| Kvinnelig gjennomsnittsalder | 50,8 |
| Retningsnumre | 819 |
| Lokal tid | mandag 18:03 |
| Tidssone | sommertid for den nordamerikanske østkysten |
| Bredde- & lengdegrad | 47.40015° / -78.99963° |
| Postnumre | J0Z |
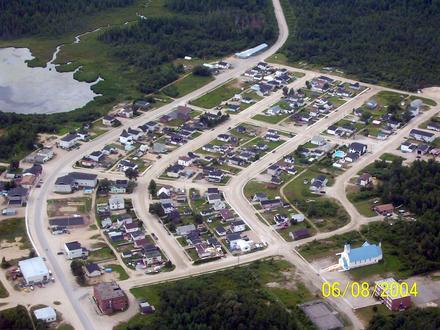
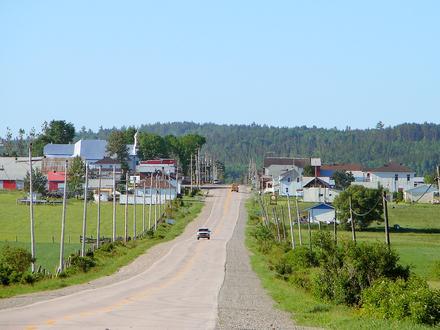
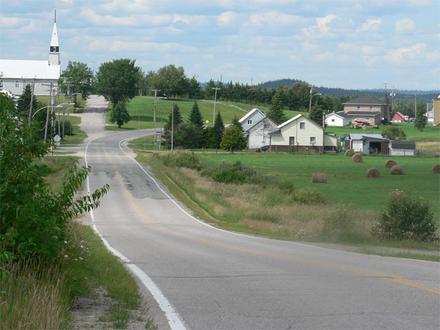
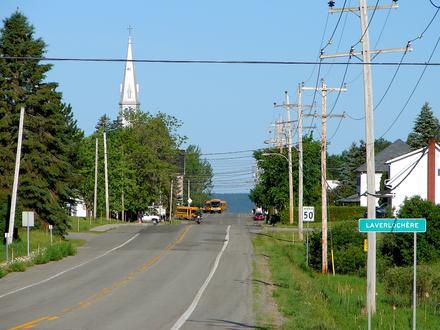
Latulipe-et-Gaboury, Québec - Kart
Latulipe-et-Gaboury, Québec Befolkningstetthet
År 1975 til 2015| Data | 1975 | 1990 | 2000 | 2015 |
|---|---|---|---|---|
| Befolkning | 386 | 363 | 340 | 304 |
| Befolkningstetthet | 1,29 / km² | 1,22 / km² | 1,14 / km² | 1,02 / km² |
Latulipe-et-Gaboury Befolkningsendringer fra 2000 til 2015
Reduksjon på 10,6 % fra år 2000 til 2015| Beliggenhet | Endring siden 1975 | Endring siden 1990 | Endring siden 2000 |
|---|---|---|---|
| Latulipe-et-Gaboury, Québec | -21,2 % | -16,3 % | -10,6 % |
| Québec | +42,5 % | +22,6 % | +12,9 % |
| Canada | +55,8 % | +30,2 % | +17,2 % |
Latulipe-et-Gaboury, Québec Gjennomsnittsalder
Gjennomsnittsalder: 50,4 år| Beliggenhet | Gjennomsnittsalder | Median alder (kvinne) | Median alder (mann) |
|---|---|---|---|
| Latulipe-et-Gaboury, Québec | 50,4 år | 50,8 år | 50 år |
| Québec | 42,2 år | 43,2 år | 41,1 år |
| Canada | 40,6 år | 41,5 år | 39,6 år |
Latulipe-et-Gaboury, Québec Befolkningstre
Befolkning etter alder og kjønn| Alder | Mann | Kvinne | Total |
|---|---|---|---|
| Under 5 år | 5 | 6 | 11 |
| 5-9 | 0 | 0 | 1 |
| 10-14 | 5 | 11 | 17 |
| 15-19 | 10 | 11 | 22 |
| 20-24 | 10 | 6 | 16 |
| 25-29 | 10 | 6 | 16 |
| 30-34 | 10 | 6 | 16 |
| 35-39 | 5 | 6 | 11 |
| 40-44 | 5 | 6 | 11 |
| 45-49 | 20 | 11 | 32 |
| 50-54 | 21 | 17 | 38 |
| 55-59 | 10 | 17 | 28 |
| 60-64 | 15 | 11 | 27 |
| 65-69 | 15 | 17 | 32 |
| 70-74 | 15 | 6 | 21 |
| 75-79 | 5 | 6 | 11 |
| 80-84 | 0 | 0 | 1 |
| 85 Pluss | 0 | 0 | 1 |
Latulipe-et-Gaboury, Québec Befolkningstetthet
Befolkningstetthet: 1,02 / km²| Beliggenhet | Befolkning | Område | Befolkningstetthet |
|---|---|---|---|
| Latulipe-et-Gaboury, Québec | 304 | 298,3 km² | 1,02 / km² |
| Québec | 7,0 millioner | 1 519 626,9 km² | 4,6 / km² |
| Canada | 35,5 millioner | 9 875 295,4 km² | 3,6 / km² |
Latulipe-et-Gaboury, Québec Historisk befolkning
Estimert urbefolkning frem til 2015Sources:
1. JRC (European Commission's Joint Research Centre) work on the GHS built-up grid
2. CIESIN (Center for International Earth Science Information Network)
3. [link] Klein Goldewijk, K., Beusen, A., Doelman, J., and Stehfest, E.: Anthropogenic land use estimates for the Holocene – HYDE 3.2, Earth Syst. Sci. Data, 9, 927–953, https://doi.org/10.5194/essd-9-927-2017, 2017.
Human Development Index (HDI)
Statistisk sammensatt indeks over forventet levealder, utdanning og inntekt per innbygger.Sources: [Link] Kummu, M., Taka, M. & Guillaume, J. Gridded global datasets for Gross Domestic Product and Human Development Index over 1990–2015. Sci Data 5, 180004 (2018) doi:10.1038/sdata.2018.4
Latulipe-et-Gaboury, Québec CO2-utslipp
Utslipp av karbondioksid (CO2) per innbygger i tonn per år| Beliggenhet | CO2-utslipp | CO2-utslipp per innbygger | CO2-utslippsintensitet |
|---|---|---|---|
| Latulipe-et-Gaboury, Québec | 4 232 am. tonn | 13,9 am. tonn | 14,2 am. tonn/km² |
| Québec | 96 902 370 am. tonn | 13,9 am. tonn | 63,8 am. tonn/km² |
| Canada | 521 999 336 am. tonn | 14,7 am. tonn | 52,9 am. tonn/km² |
Latulipe-et-Gaboury, Québec CO2-utslipp
| 2013 CO2-utslipp (tonn/år) | 4 232 am. tonn |
| 2013 CO2-utslipp (tonn/år) per capita | 13,9 am. tonn |
| 2013 CO2-utslipp intensitet (tonn/km²/år) | 14,2 am. tonn/km² |
Naturlige farer
Relativ risiko av 10| Jordskjelv | Medium (3,9) |
* Risiko, spesielt for flom eller skred, kan ikke være for hele området.
Sources: 1. Dilley, M., R.S. Chen, U. Deichmann, A.L. Lerner-Lam, M. Arnold, J. Agwe, P. Buys, O. Kjekstad, B. Lyon, and G. Yetman. 2005. Natural Disaster Hotspots: A Global Risk Analysis. Washington, D.C.: World Bank. https://doi.org/10.1596/0-8213-5930-4.
2. Center for Hazards and Risk Research - CHRR - Columbia University, Center for International Earth Science Information Network - CIESIN - Columbia University. 2005. Global Earthquake Hazard Distribution - Peak Ground Acceleration. Palisades, NY: NASA Socioeconomic Data and Applications Center (SEDAC). https://doi.org/10.7927/H4BZ63ZS.
Nylige jordskjelv i nærheten
Størrelse 3.0 og større| Dato | Tid | Omfanget | Avstand | Dybde | Beliggenhet | link |
|---|---|---|---|---|---|---|
| 02.05.2015 | 01:34 | 3,3 | 64,1 km | 18 000 m | 17km NE of Temiscaming, Canada | usgs.gov |
| 01.01.2000 | 03:22 | 4,7 | 57,2 km | 18 000 m | southern Quebec, Canada | usgs.gov |
| 12.08.1982 | 18:06 | 3,7 | 89 km | 18 000 m | southern Quebec, Canada | usgs.gov |
| 19.12.1975 | 07:25 | 3,8 | 45,9 km | 18 000 m | southern Quebec, Canada | usgs.gov |
| 31.10.1935 | 22:03 | 5,6 | 59,1 km | 1 000 m | Ontario, Canada | usgs.gov |
Om våre data
Dataene på denne siden er estimert ved å bruke et antall offentlig tilgjengelige verktøy og ressurser. Det leveres uten garanti, og kan inneholde unøyaktigheter. Bruk på egen risiko. Se her for mer informasjon.