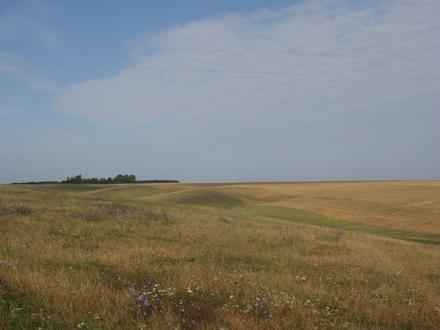
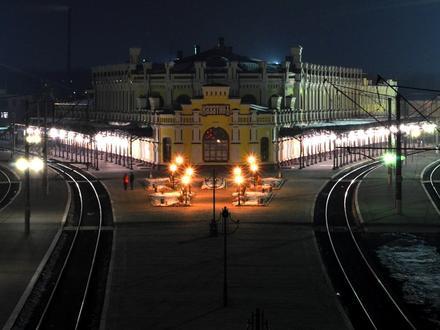
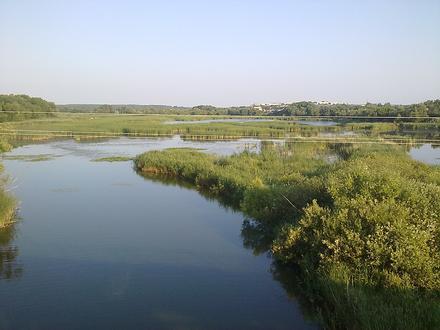
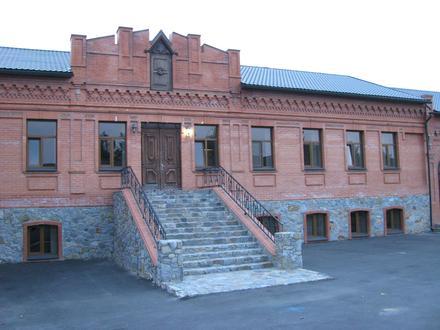
Virksomheter i Pohrebyshche
Hoteller og reiser
Restauranter
Automotiv
Økonomiske tjenester
Medisinsk
Skjønnhet og spa
Kommune og Region
Industries
Forretningsdistribusjon etter næring Handling: 28,4 %
Mat: 11 %
Industri: 9 %
Økonomiske tjenester: 5,6 %
Hjelp til hjemmet: 5,2 %
Profesjonelle tjenester: 5 %
Andre: 35,8 %
| Område for Pohrebyshche, Vinnytsia oblast | 8,8 km² |
| Befolkning | 7 117 |
| Mannlig befolkning | 3 201 (45 %) |
| Befolkning av kvinner | 3 916 (55 %) |
| Befolkningsendring fra 1975 til 2015 | -41,6 % |
| Befolkningsendring fra 2000 til 2015 | -24,5 % |
| Gjennomsnittsalder | 40,7 |
| Mannlig gjennomsnittsalder | 37,1 |
| Kvinnelig gjennomsnittsalder | 43,6 |
| Retningsnumre | 4346 |
| Lokal tid | fredag 05:01 |
| Tidssone | østeuropeisk sommertid |
| Bredde- & lengdegrad | 49.48639° / 29.26361° |
| Postnumre | 22200, 22209, 22216, 22262, 22271 |
Pohrebyshche, Vinnytsia oblast - Kart
Pohrebyshche, Vinnytsia oblast Befolkningstetthet
År 1975 til 2015| Data | 1975 | 1990 | 2000 | 2015 |
|---|---|---|---|---|
| Befolkning | 12 189 | 11 695 | 9 422 | 7 117 |
| Befolkningstetthet | 1 381 / km² | 1 325 / km² | 1 068 / km² | 806,9 / km² |
Pohrebyshche Befolkningsendringer fra 2000 til 2015
Reduksjon på 24,5 % fra år 2000 til 2015| Beliggenhet | Endring siden 1975 | Endring siden 1990 | Endring siden 2000 |
|---|---|---|---|
| Pohrebyshche, Vinnytsia oblast | -41,6 % | -39,1 % | -24,5 % |
| Vinnytsia oblast | -15,3 % | -17,1 % | -10,8 % |
| Ukraina | -8,6 % | -13,1 % | -8,3 % |
Pohrebyshche, Vinnytsia oblast Gjennomsnittsalder
Gjennomsnittsalder: 40,7 år| Beliggenhet | Gjennomsnittsalder | Median alder (kvinne) | Median alder (mann) |
|---|---|---|---|
| Pohrebyshche, Vinnytsia oblast | 40,7 år | 43,6 år | 37,1 år |
| Vinnytsia oblast | 40,6 år | 43,5 år | 37,1 år |
| Ukraina | 40 år | 43 år | 36,5 år |
Pohrebyshche, Vinnytsia oblast Befolkningstre
Befolkning etter alder og kjønn| Alder | Mann | Kvinne | Total |
|---|---|---|---|
| Under 5 år | 196 | 192 | 389 |
| 5-9 | 171 | 170 | 341 |
| 10-14 | 168 | 164 | 332 |
| 15-19 | 204 | 200 | 405 |
| 20-24 | 250 | 250 | 501 |
| 25-29 | 282 | 289 | 572 |
| 30-34 | 229 | 249 | 478 |
| 35-39 | 237 | 260 | 497 |
| 40-44 | 236 | 259 | 496 |
| 45-49 | 230 | 259 | 489 |
| 50-54 | 238 | 283 | 522 |
| 55-59 | 199 | 257 | 456 |
| 60-64 | 178 | 256 | 434 |
| 65-69 | 104 | 174 | 278 |
| 70-74 | 126 | 249 | 375 |
| 75-79 | 81 | 169 | 250 |
| 80-84 | 46 | 136 | 182 |
| 85 Pluss | 25 | 102 | 127 |
Pohrebyshche, Vinnytsia oblast Befolkningstetthet
Befolkningstetthet: 806,9 / km²| Beliggenhet | Befolkning | Område | Befolkningstetthet |
|---|---|---|---|
| Pohrebyshche, Vinnytsia oblast | 7 117 | 8,8 km² | 806,9 / km² |
| Vinnytsia oblast | 1,6 millioner | 26 494,3 km² | 60,4 / km² |
| Ukraina | 42,3 millioner | 574 117,9 km² | 73,8 / km² |
Pohrebyshche, Vinnytsia oblast Historisk og fremtidig anslått befolkning
Estimert innbyggertall fra 500 til 2100Sources:
1. JRC (European Commission's Joint Research Centre) work on the GHS built-up grid
2. CIESIN (Center for International Earth Science Information Network)
3. [link] Klein Goldewijk, K., Beusen, A., Doelman, J., and Stehfest, E.: Anthropogenic land use estimates for the Holocene – HYDE 3.2, Earth Syst. Sci. Data, 9, 927–953, https://doi.org/10.5194/essd-9-927-2017, 2017.
Human Development Index (HDI)
Statistisk sammensatt indeks over forventet levealder, utdanning og inntekt per innbygger.Sources: [Link] Kummu, M., Taka, M. & Guillaume, J. Gridded global datasets for Gross Domestic Product and Human Development Index over 1990–2015. Sci Data 5, 180004 (2018) doi:10.1038/sdata.2018.4
Pohrebyshche, Vinnytsia oblast CO2-utslipp
Utslipp av karbondioksid (CO2) per innbygger i tonn per år| Beliggenhet | CO2-utslipp | CO2-utslipp per innbygger | CO2-utslippsintensitet |
|---|---|---|---|
| Pohrebyshche, Vinnytsia oblast | 34 575 am. tonn | 4,86 am. tonn | 3 920 am. tonn/km² |
| Vinnytsia oblast | 7 429 217 am. tonn | 4,64 am. tonn | 280,4 am. tonn/km² |
| Ukraina | 197 794 395 am. tonn | 4,67 am. tonn | 344,5 am. tonn/km² |
Pohrebyshche, Vinnytsia oblast CO2-utslipp
| 2013 CO2-utslipp (tonn/år) | 34 575 am. tonn |
| 2013 CO2-utslipp (tonn/år) per capita | 4,86 am. tonn |
| 2013 CO2-utslipp intensitet (tonn/km²/år) | 3 920 am. tonn/km² |
Om våre data
Dataene på denne siden er estimert ved å bruke et antall offentlig tilgjengelige verktøy og ressurser. Det leveres uten garanti, og kan inneholde unøyaktigheter. Bruk på egen risiko. Se her for mer informasjon.